search

April 9, 2026

Why PK parameters matter

PK parameters are not โ€œjust statistics.โ€ They are a compact language for exposure, often the most measurable bridge between what you administer, such as dose, formulation, or regimen, and what the body experiences in terms of systemic drug concentration over time. Regulators and development teams use pharmacokinetic (PK) metrics to compare products in bioequivalence (BE) assessments, predict and manage drugโ€“drug interactions (DDIs), justify dosing in special populations, and interpret whether a formulation or dosing regimen change is likely to have clinical relevance.

The concentration time curve as the foundation of PK parameters

At the center is the concentrationโ€“time curve. From this curve we extract exposure and timing descriptors. The EMA explicitly frames BE around the plasma concentrationโ€“time curve, where AUC reflects the extent of exposure, while Cmax and tmax are influenced by absorption rate.

The essential PK parameters and how to read them correctly

wdt_ID wdt_created_by wdt_created_at wdt_last_edited_by wdt_last_edited_at Parameter Definition (plain language) Mathematical intuition (very short) Biological meaning (typical) Development relevance Common misconceptions
1 DaniellePillsbury 09/04/2026 05:02 PM DaniellePillsbury 09/04/2026 05:02 PM Cmax Maximum observed concentration Sample-based maximum; sensitive to early sampling Proxy for peak systemic burden BE endpoint; peak-driven safety concerns in some settingsโ€ฏ โ€œHigher Cmax always means better efficacyโ€ (depends on exposureโ€“response)โ€ฏ
2 DaniellePillsbury 09/04/2026 05:03 PM DaniellePillsbury 09/04/2026 05:03 PM Tmax Time to reach Cmax Argmax time; unstable with sparse sampling Absorption rate influenced timing Often supportive (not always required statistically)โ€ฏ โ€œDifferent Tmax always means non-equivalenceโ€
3 DaniellePillsbury 09/04/2026 05:04 PM DaniellePillsbury 09/04/2026 05:04 PM AUC Area under concentrationโ€“time curve Integral (often trapezoids in NCA) Overall systemic exposure BE endpoint; basis for many dose/exposure discussionsโ€ฏ โ€œAUC tells you mechanismโ€ (itโ€™s integrative, not mechanistic)
4 DaniellePillsbury 09/04/2026 05:05 PM DaniellePillsbury 09/04/2026 05:05 PM Half-life (tยฝ) Time for concentration to halve in terminal phase tยฝ = 0.693ยทV/CL (linear)โ€ฏ Joint signal of distribution + elimination Washout, accumulation, dosing interval planningโ€ฏ โ€œLong tยฝ means low clearanceโ€ (could also be high V)โ€ฏ
5 DaniellePillsbury 09/04/2026 05:06 PM DaniellePillsbury 09/04/2026 05:06 PM Clearance (CL) โ€œVolumeโ€ cleared per time CL = Rate_elim / C; also CL = FยทDose/AUC Elimination capacity (integrating organs/processes) Core for dose scaling and DDI/subpopulation impactโ€ฏ โ€œCL is how much drug is removed per hourโ€ (itโ€™s a proportionality)โ€ฏ
6 DaniellePillsbury 09/04/2026 05:07 PM DaniellePillsbury 09/04/2026 05:11 PM Volume of distribution (Vd) Apparent volume relating amount to concentration Vd โ‰ˆ Amount / C (conceptually) Extent of distribution outside plasma Loading dose logic; interpreting tยฝ shiftsโ€ฏ โ€œVd is an anatomical volumeโ€ (itโ€™s an apparent/theoretical one)

Cmax: The peak plasma level a drug reaches

  • Definition:โ€ฏCmax (maximum observed concentration) is the highest measured drug concentration in the sampled concentration time profile, often in plasma or serum.
  • Mathematical intuition:โ€ฏCmax is a function of both the true peak and the sampling schedule. FDA explicitly notes that if the first sample is the highest point, Cmax may be biased due to insufficient early sampling.
  • Biological meaning:โ€ฏOften a proxy for peak systemic burden; sometimes relevant for acute adverse events or rapid-onset pharmacology (context dependent).
  • Development relevance:โ€ฏIn EU BE, Cmax is a required parameter (with AUC) for single-dose studies.
  • Common misconceptions:โ€ฏโ€œCmax is the efficacy metric.โ€ Eโ€“R guidance stresses that clinical decisions need exposureโ€“response understanding, not a single PK number.

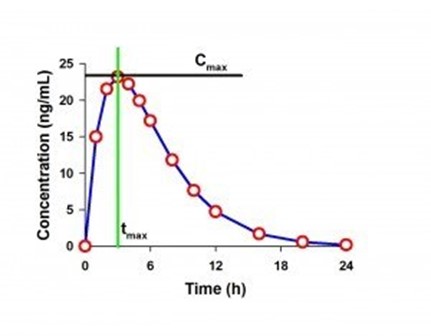
Fig.: Example PK Curve with Cmax and tmax labeled

Tmax: Capturing the speed of absorption

  • Definition:โ€ฏTime to reach Cmax.
  • Mathematical intuition:โ€ฏTmax is discrete (depends on sampling times), making it noisy and sometimes non-symmetric statistically.
  • Biological meaning:โ€ฏInfluenced by absorption rate; in BE contexts, EMA notes Cmax and tmax are influenced by absorption rate.
  • Development relevance:โ€ฏEMA states statistical evaluation of tmax is not required, but if rapid release is clinically important (onset or adverse events), there should be no โ€œapparentโ€ difference in median tmax and its variability.
  • Common misconceptions:โ€ฏโ€œDifferent Tmax always fails BE.โ€ In many cases, it is supportive rather than primary.

AUC: Measuring total drug exposure over time

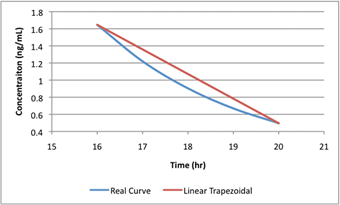
Fig.: Linear AUC assumes straight lines; real curves are not.

  • Definition:โ€ฏArea under the concentrationโ€“time curve, i.e., total exposure over time.
  • Mathematical intuition:โ€ฏAUC is an integral; in practice NCA uses trapezoidal approximations between observed points, plus a terminal extrapolation if estimating AUCโˆž.
  • Biological meaning:โ€ฏIn linear kinetics, AUC increases with dose and decreases with clearance.
  • Development relevance:โ€ฏEMA specifies AUC(0โ€“t) (or, when relevant, AUC(0โ€“72h)) and Cmax for single-dose BE, with 90% CI acceptance 80.00โ€“125.00%.
  • Common misconceptions:โ€ฏโ€œAUC captures absorption speed.โ€ AUC is primarily an extent-of-exposure metric; rate can change Cmax/Tmax without changing AUC.

Half-life (tยฝ): Understanding drug persistence over time

  • Definition:โ€ฏTime for concentration to fall by half during the terminal phase (under linear/first-order assumptions).
  • Mathematical intuition:โ€ฏtยฝ = 0.693/ke and, because CL = keยทVd, also tยฝ = 0.693ยทVd/CL.
  • Biological meaning:โ€ฏNot a โ€œpure eliminationโ€ metric โ€“ distribution (Vd) and elimination (CL) both matter.
  • Development relevance:โ€ฏGuides washout length, sampling duration, and accumulation expectations for repeated dosing (regimen design).
  • Common misconceptions:โ€ฏโ€œLong half-life implies organ failure or low CL.โ€ Half-life can increase if Vd increases even at constant CL.

Clearance (CL): The bodyโ€™s capacity to eliminate drug

  • Definition:โ€ฏโ€œRate of drug elimination divided by plasma concentration,โ€ yielding an apparent plasma volume cleared per unit time.
  • Mathematical intuition:โ€ฏIn linear kinetics, CL links dose and exposure: AUC = FยทDose/CL (so CL = FยทDose/AUC).
  • Biological meaning:โ€ฏSummarizes elimination rate across pathways (renal/hepatic/other).
  • Development relevance:โ€ฏA primary driver of dose requirements and a key object/perpetrator concept in DDI workstreams (changes in CL often explain AUC changes).
  • Common misconceptions:โ€ฏโ€œCL tells you how much drug is removed per hour.โ€ It is a proportionality; mg/h depends on concentration and CL.

Volume of distribution (Vd): How far a drug travels beyond the bloodstream

  • Definition:โ€ฏAn apparent/theoretical volume indicating the extent of distribution relative to plasma concentration.
  • Mathematical intuition:โ€ฏConceptually, Amount โ‰ˆ CยทVd (so Vd โ‰ˆ Amount/C).
  • Biological meaning:โ€ฏA high volume of distribution typically indicates extensive distribution into tissues (or binding), not a โ€œbigger body.โ€
  • Development relevance:โ€ฏInfluences loading-dose logic and helps interpret half-life changes (since tยฝ depends on Vd and CL).
  • Common misconceptions:โ€ฏโ€œVd is anatomical volume.โ€ It is explicitly described as apparent/theoretical.

Linking dose, clearance, and exposure: The core PK equations

wdt_ID wdt_created_by wdt_created_at wdt_last_edited_by wdt_last_edited_at Concept Key Equation What It Shows Why It Matters
1 DaniellePillsbury 09/04/2026 06:27 PM DaniellePillsbury 09/04/2026 06:29 PM One compartment IV bolus model C(t) = C0 ยท e^(โˆ’ke ยท t) C0 = Dose / Vd Concentration declines exponentially after IV bolus dosing Foundation for deriving exposure relationships
2 DaniellePillsbury 09/04/2026 06:29 PM DaniellePillsbury 09/04/2026 06:29 PM AUC derivation (IV) AUC(0โ†’โˆž) = โˆซโ‚€^โˆž C(t) dt = C0 / ke = (Dose / Vd) / ke Total exposure equals initial concentration divided by elimination rate constant Connects exposure directly to elimination
3 DaniellePillsbury 09/04/2026 06:29 PM DaniellePillsbury 09/04/2026 06:29 PM Clearance relationship CL = ke ยท Vd โ†’ AUC = Dose / CL (IV) AUC is inversely proportional to clearance Decreased clearance increases exposure
4 DaniellePillsbury 09/04/2026 06:29 PM DaniellePillsbury 09/04/2026 06:29 PM Extravascular dosing AUC = F ยท Dose / CL Exposure depends on bioavailability and clearance Explains oral dosing and DDI effects
5 DaniellePillsbury 09/04/2026 06:30 PM DaniellePillsbury 09/04/2026 06:30 PM Half life relationship tยฝ = 0.693 / ke โ†’ tยฝ = 0.693 ยท Vd / CL Half life depends on both distribution and clearance Long half life does not automatically mean low clearance
6 DaniellePillsbury 09/04/2026 06:30 PM DaniellePillsbury 09/04/2026 06:31 PM Steady state average concentration Cavg,ss = (F ยท Dose) / (CL ยท ฯ„) Average exposure over a dosing interval depends on dose, clearance, and interval Guides regimen design and dose adjustments

Numeric intuition builders

wdt_ID wdt_created_by wdt_created_at wdt_last_edited_by wdt_last_edited_at Scenario Inputs Result Interpretation
1 DaniellePillsbury 09/04/2026 06:27 PM DaniellePillsbury 09/04/2026 06:35 PM Example A: Clearance decreases Dose = 100 mg CL = 5 L/h AUC = 100 / 5 = 20 mgยทh/L Baseline exposure
2 DaniellePillsbury 09/04/2026 06:29 PM DaniellePillsbury 09/04/2026 06:36 PM CL decreases to 2.5 L/h AUC = 100 / 2.5 = 40 mgยทh/L Halving clearance doubles exposure. Explains DDI or organ impairment effects
3 DaniellePillsbury 09/04/2026 06:29 PM DaniellePillsbury 09/04/2026 06:36 PM Example B: Absorption slows Same Dose and CL Slower absorption rate AUC similar Cmax lower Tmax later Rate can change peak and timing without changing total exposure

Common pitfalls in translating PK parameters into decisions

A common pitfall in pharmacokinetic interpretation is over-reliance on single PK parameters. AUC and Cmax answer different questions: AUC reflects total exposure, while Cmax reflects peak concentration. Exposureโ€“response considerations determine which matters more in a given context, so interpreting either in isolation can mislead.

Sampling artifacts are another risk. Insufficient early sampling can produce a โ€œfirst point Cmax,โ€ biasing peak estimates, and inadequate sampling around Tmax can distort peak timing and magnitude.

Half-life is often misread as elimination speed, yet it depends on both clearance and volume of distribution (tยฝ = 0.693 ยท Vd / CL). A longer half-life does not necessarily mean reduced clearance.

AUC truncation can also be problematic. In flip-flop kinetics, where absorption drives the terminal phase, truncated AUC may misrepresent exposure.

Finally, apparent parameters should not be treated as physiological truths. The volume of distribution is a theoretical construct, not an anatomical space.

NCA vs model-based (PopPK, PBPK, MIDD): Pros/cons and when to use

PK parameters can be derived and interpreted using different analytical approaches, including NCA, PopPK, PBPK, and broader model informed drug development frameworks. Each method uses PK parameters differently, ranging from descriptive summaries to mechanistic prediction. Choosing the right approach depends on the development and regulatory question at hand.

NCA (noncompartmental analysis)

  • Pros: fast, transparent, widely accepted for standard BE endpoints; EMA requires NCA and rejects compartmental methods for BE parameter estimation.
  • Cons: limited extrapolation; sparse sampling and complex kinetics can make terminal slope (and thus AUCโˆž, half-life) fragile.

PopPK (population PK)

  • Pros: quantifies variability and covariate effects, supports individualized dosing and labeling; FDA describes PopPK as frequently used to guide development and therapeutic individualization and gives expectations for submissions and report content.
  • Cons: requires stronger assumptions and careful diagnostics; EMA stresses clarity of assumptions/decisions to enable secondary evaluation.

PBPK (physiologically based PK)

  • Pros: mechanistic; useful for DDI prediction and dose selection (e.g., pediatric, first-in-human) and supports โ€œwhat ifโ€ simulations; EMA defines PBPK and notes these common regulatory purposes.
  • Cons: platform and model qualification and documentation burden is high; EMA explicitly notes platforms need qualification for intended use when supporting regulatory decisions.โ€ฏFDA provides expectations for submitting PBPK analyses (format/content).

MIDD (model-informed drug development)

A forward-looking umbrella: ICH M15 provides general principles and a harmonized evidence framework; the EMA Step 5 page lists a legal effective date ofโ€ฏ23 July 2026โ€ฏ(after today).

How software enables robust PK parameter assessment

PK parameters may be conceptually straightforward, but their accurate calculation depends on validated analytical software. In modern drug development, platforms such as Phoenix WinNonlinยฎ are widely used to derive key PK parameters including AUC, Cmax, Tmax, clearance, volume of distribution, and half life from concentration time data.

These tools apply standardized noncompartmental methods, ensure reproducibility, and provide the traceability required for regulatory submissions. Beyond basic calculations, software environments increasingly support modeling and simulation, embedding PK parameters within broader decision frameworks.

Reliable pharmacokinetic software therefore ensures that PK parameters are calculated consistently, interpreted correctly, and confidently used in regulatory and development decisions.

Conclusion: Integrating PK parameters for robust decisions

PK parameters are decision tools, not trophies: each metric answers a specific question, and the most robust conclusions come from patterns across PK parameters, such as AUC, Cmax, half life, and clinical context, rather than from isolated numbers. Interpreting PK parameters in combination allows teams to distinguish between changes in absorption, distribution, and clearance instead of reacting to a single shifted value.

For regulator facing decisions, align your endpoints and interpretation of PK parameters with the intended use, whether bioequivalence, label changes, drug-drug interaction management, or dosing in special populations. At the same time, remain explicit about underlying assumptions such as linearity, route of administration, bioavailability, and sampling adequacy, because the meaning of PK parameters depends directly on these foundations.

Learn more about Phoenix WinNonlin

Calculate and interpret PK parameters with confidence using Phoenix WinNonlin, industry trusted platforms that deliver validated noncompartmental analysis, modeling, and scalable cloud based workflows for modern drug development.

Learn moreBook a demo

Author

Sebastian Kuechenmeister

Senior Marketing Manager

Sebastian Kuchenmeister has been a Senior Marketing Manager at Certara since 2022. He is a creative marketing professional with extensive expertise in multiple marketing disciplines, campaign management, media planning and a passion for content creation and go-to market strategies. Mr. Kuchenmeister earned a Bachelor of Arts degree in Political Science from the Humboldt University in Berlin, Germany.

Schedule a Phoenix demo

Ready to See Phoenix in Action? Transform your PK/PD analyses with a guided demo tailored to your needs. Weโ€™ll show you how Phoenix can bridge your journey across drug development.

Industry standard PK/PD analysis
Noncompartmental analysis
Bioequivalence
Nonlinear mixed effects analysis
IVIVC toolkit