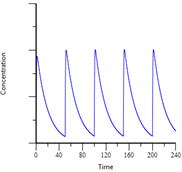
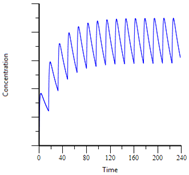
A reader, Michael, asked me to discuss the concept of accumulation. This term is used frequently in both the nonclinical and clinical setting. Some people use the word with fear, while others explain it in complicated terms. Accumulation represents the relationship between the dosing interval and the rate of elimination for the drug. When the dosing interval is long relative to the time needed to eliminate the drug, accumulation is low. When the dosing interval is short relative to the time needed to eliminate the drug, accumulation is high. Thus, changing the dosing interval can change accumulation. The value for accumulation is not “good” or “bad”, despite what people may say. It simply “is”. The important piece to remember regarding accumulation is what are the actual drug levels at steady-state (maximum accumulation), and are those levels associated with efficacy and/or toxicity? If those levels are associated with toxicity, you can increase the dosing interval to lower the accumulation and hopefully avoid toxicity.
Imagine a funnel under a water faucet. If you turn on the water faucet slowly, and run the water through the funnel, the water level in the funnel will not rise as long as the faucet output (input rate) is slower than the funnel output (output rate). If you increase the amount of water flowing through the faucet, the level of water in the funnel will rise until it reaches “steady-state” where the input and output rate are equal. Further increases in the faucet flow rate will cause the funnel to overflow. The level of water in the funnel is considered the accumulation, and it rises with increases in the input rate.
How to calculate Accumulation Ratio (AR)
The accumulation ratio can be calculated using PK parameters or from observed data. All of these methods give reasonable estimates but have slightly different drawbacks. The first method is to use the dosing interval and elimination rate constant and the following equation to calculate the accumulation ratio (AR):
This method requires knowledge of the terminal elimination rate constant (k) following a single dose of the compound. This elimination rate constant can be calculated from the clearance and volume, terminal half-life, or the terminal slope of the concentration-time profile. The dosing interval (τ) is the time between successive doses. For once-daily (qd), this would be 24 hours. Make sure that the units for k and τ are the same before you complete the calculation. This equation assumes first-order elimination of the drug. The denominator estimates the proportion of drug eliminated after one dosing interval. The advantage of this method is that you can predict the accumulation ratio after many different dosing regimens by inserting different dosing intervals. For example, you could estimate the accumulation ratio after once-, twice-, and thrice-daily dosing very quickly if you know the elimination rate constant and use this equation. The disadvantage is that the calculation is highly dependent upon the estimate for the elimination rate constant. If that parameter is poorly estimated, then values for the accumulation ratio will be biased.
The second method is to use observed data from a study where you have measurements after a single dose and at steady-state, using one of the following equations:
All of these equations are similar in that they take the ratio of an exposure parameter at steady-state and divide it by that same parameter after a single dose. The assumption is that once steady-state has been achieved, no further accumulation will occur. At that point, the ratio of any measure of exposure at steady-state will be proportional to the same measure after a single dose in the amount of the accumulation ratio. The advantage of this method is that it can be easily calculated directly from the data. If you measure AUC on Day 1 and Day 28 of a toxicokinetic study, you can calculate the accumulation ratio. In addition, multiple measures can be used to verify the calculations. The disadvantage is that you may generate multiple values for accumulation ratio if the PK parameters vary widely. For example, Cmax could be poorly estimated at steady-state because tmax is delayed and the sampling scheme is too sparse at the new tmax. Another difficulty with this method is that one often has to assume steady-state was achieved without independent confirmation from multiple measurements at steady-state. Even with these disadvantages, this method offers a quick way to calculate accumulation ratio from observed data.
Using the Accumulation Ratio
Combining these two types of equations for accumulation ratio provides the pharmacokineticist an opportunity to use observational information to make predictions. For example, the accuracy of the elimination rate constant calculation can be evaluated by comparing the accumulation ratios calculated from the first and second methods. If the AR values are similar, then it is likely that the elimination rate constant value used is accurate. If the elimination rate constant cannot be calculated (e.g. t1/2 is > 6 hours, and τ is 24 hrs), one could calculate the accumulation ratio using method 2 (e.g. AUC or Cmax), and then input that AR value into the equation for method 1, and solve for k. As mentioned previously, using method 1, the AR can be calculated for a variety of dosing intervals. The resulting AR values can then be used to predict exposure parameters (i.e. AUC, Cmax, Ctrough) at steady-state for those dosing intervals. These exposure parameters can be predicted using the equations for method 2 along with the AR and the associated parameter following a single dose.
In conclusion, the accumulation ratio is a simple, but useful calculation of the relationship between the dosing interval and the elimination rate constant. The manifestation of this relationship is a rise in steady-state drug exposure parameters as the dosing interval shrinks relative to the elimination rate constant. Accumulation is often wrongly associated with toxicity, thus it is often spoken of in the context of toxicokinetic analysis. Accumulation is simply a reflection of how much drug is being added to the body relative to how much is being eliminated from the body during a defined period of time. And that ratio can be controlled by changing the dosing frequency.
To learn about how we’ve improved Phoenix to make performing NCA and PK/PD modeling even easier, please watch this webinar I gave on the latest enhancements to Phoenix.