search

March 20, 2026

Bioequivalence (BE) enables bridging safety and effectiveness of oral pharmaceutical dosage forms using pharmacokinetics. In this blog, we’ll discuss what are common bioequivalence study mistakes, and how you can fix them.

For starters, bioequivalence is a technical biopharmaceutics term baked into regulation. The Code of Federal Regulations (CFR) Subchapter D deals with drugs for human use. Section 320.1 contains the key definitions regarding this subject:

§ 320.1 Definitions. What is bioequivalence vs bioavailability?

Bioavailability is defined in (a.) as:

Bioavailability [BA] means the rate and extent to which the active ingredient or active moiety is absorbed from a drug product and becomes available at the site of action.

Bioequivalence is defined in (e.) as:

Bioequivalence means the absence of a significant difference in the rate and extent to which the active ingredient or active moiety in pharmaceutical equivalents or pharmaceutical alternatives becomes available at the site of drug action when administered at the same molar dose under similar conditions in an appropriately designed study.

That is one heavily nuanced definition. However, as with all things legal, interpretation is highly contextual. It doesn’t say to show bioequivalence within the confidence bounds of 0.8 and 1.25. In addition, it doesn’t say that the dose of the test or reference should be identical. Let’s try to understand the scientific basis behind the phrase “absence of a significant difference” which is so important in bioequivalence.

The United States FDA considers two products to be bioequivalent if the 90% confidence intervals of the geometric mean test/reference Cmax and AUC ratios fall within the bioequivalence confidence intervals of 80-125%. To obtain geometric means, the pharmacokinetic data are log-transformed prior to conducting an analysis of variance. They are then back-transformed before calculating the test/reference ratios.

Figure 1. Two products are bioequivalent if the 90% confidence intervals of the geometric mean test/reference Cmax and AUC ratios fall within the bioequivalence confidence intervals of 80-125%.

Geometric mean ratios and log-transformed data are used to test the hypothesis that the 90% confidence interval of total exposure and maximum concentration fall within the acceptance limits of 80–125%. Total exposure is the area under the plasma concentration time curve from pre-dose to the last measurable time point, AUC0 to last extrapolated to infinity. The maximum concentration refers to the peak exposure. This is the single point estimate of maximum observed concentration in the plasma concentration time curve.

What constitutes a clinically acceptable change has been debated. Thresholds of clinical relevance in the order of a 20–25% change has been discussed widely (Williams et al., 1976). There was this 75/75 rule that stated that two formulations are equivalent if at least 75% of the individuals being tested had ratios (of the various pharmacokinetic parameters obtained from the individual results) between the 75% and 125% limits, and the study had the statistical power to detect a small 20% difference between the two formulations.

In 1992, the FDA published the guidance on “Statistical Procedures for Bioequivalence Studies Using a Standard Two-treatment Crossover Design.” Its recommended statistical approach was based on average bioequivalence and underpins the assessment of BE based on the confidence interval approach. Let’s reflect now on some frequent bioequivalence myths.

Myth 1: I must bridge my formulations before using a new capsule in Phase 3. I need a BE study, and I need to use “BE bounds.”

This is a common misunderstanding. The expectation for bioequivalence is when the formulation that is taken into a pivotal registrational study (e.g., Phase 3) undergoes further formulation changes during or after phase 3 and before commercialization. A bioequivalence study is necessary if the variance around the changes made to the formulation deviates as specified in the SUPAC IR (immediate release) guidance (FDA, 1995).

Formulations will evolve during the IND stage of development. For example, the sponsor may move from a drug in bottle suspension from Phase 1 to a capsule in Phase 2. For these “internal” bridging studies, just a relative BA study is needed to determine whether to dose adjust before taking the new formulation into the next study. No BE study or meeting BE bounds are necessary.

Myth 2: I am an innovator company. I have a product with a wide therapeutic window. I know regulatory agencies require BE bounds to be met for my product.

You have valuable data on the PK, exposure-response, safety, and efficacy of your product. These data can be leveraged to justify the clinical meaningfulness of any PK differences seen in your BE studies.

FDA guidance explicitly calls out approaches when BE studies fail: “When BE is not demonstrated, the sponsor should demonstrate that the differences in rate and extent of absorption do not significantly affect the safety and efficacy based on available dose-response or concentration-response data. In the absence of this evidence, failure to demonstrate BE may suggest that the test product should be reformulated, or the method of manufacture for the test product should be changed, or additional safety or efficacy data may be needed for the test product.” (FDA, 2014).

One common mitigation is to power the study for BE bounds. Then justify the reasons for failure, if possible, versus being creative with bounds.

Myth 3: I am doing a food effect study with my new reformulated dosage form. I need to use BE bounds as a criterion of clinical significance.

A food effect study shouldn’t be confused with a fed BE study. A fed BE study is required for generic product approval in addition to a fasted BE study.

A food effect study is typically performed in the new drug application package for a new molecular entity. As such, it is a descriptive study and serves to understand the effect of a patient having a standard high fat breakfast on the performance of the dosage form simulating a “worst case scenario.” Thus, powering a study for BE criterion is not required.

Myth 4: I have failed f2 in multi-media dissolution test. I can use modeling to show the differences are not clinically meaningful. I will not need to demonstrate BE.

When comparing two formulations for bioequivalence, the first in vitro analytical test used is the similarity factor, called “f2” (Krishna and Yu, 2007). F2 measures the similarity of the dissolution profile between the test product (usually a newer or revised formulation) and the reference product (usually a product that has been used until now, or the innovator product when considering generic equivalent).

Such a test is done under exploratory contexts or within acceptable regulatory contexts. To adhere to the latter bar, pay attention to the volume and type of dissolution media, rpm conditions, and defined sample size to meet the multi-media dissolution conditions. Then sample the media to measure drug amount dissolved to generate a dissolution curve for the products. Finally, use the data to calculate the f2.

\displaystyle f_2 = 50 \cdot \log\!\left[100 \cdot \frac{1}{\sqrt[2]{1 + \frac{1}{n}\sum_{t=1}^{n}(R_t - T_t)^2}}\right]

In the above referenced equation, f2 is the similarity factor, Rt and Tt are the cumulative percentage dissolved at each selected time point for the reference (R) product and test (T) product. Dissolution profiles are considered similar when the f2 value is ≥50.

In general, f2 failure (any value of f2 that is <50) triggers an in vivo BE study. If f2 fails, the probability of meeting bioequivalence is usually low.

At this stage, many sponsors will improve the dosage form performance. Sponsors can look at the formulation design space and re-adjust accordingly. The principles of model-informed drug development can be used to rationalize that the changes aren’t clinically meaningful.

Myth 5: I changed my formulation from that used in phase 3. I can market my new formulation without running a BE study.

When you change a formulation meaningfully (i.e., as specified in SUPAC guidances) from that used in Phase 3, you need to perform a sufficiently powered BE study to show that the formulations are not meaningfully different. A failed BE study becomes an approvability issue if the differences are clinically meaningful. There is considerable room to renegotiate this scenario using integrative analyses and tools.

Be aware of certain post-approval changes that may trigger a BE study as well (e.g., SUPAC IR). Major changes in components, composition, manufacturing site, and/or method of manufacture after approval may require demonstrating in vivo BE for the new drug product.

Myth 6: I need to use the identical dose of test and reference products for showing bioequivalence.

Let’s go back to the CFR definition of bioequivalence. What does it say for dose? It says, “same molar dose,” right? But does that mean the dose has to be identical to what is being used in a dosage form (e.g., labeled 100 mg)? Or does it mean the bioavailable dose? Well, it’s open to interpretation.

Let’s look at an important precedent that changed the way we look at “same molar dose”.

Abbott’s Tricor (fenofibrate) was developed in the early 2000s, and the sponsor filed a series of formulation switches using the 505(b)(2) pathway (FDA approval dossier). Ring a bell? Let’s look at hard evidence. Looking at the summary basis of approval, we see that “Tricor fenofibrate test “EZ” tablets (1 x 145 mg, or 3 x 48 mg) was bioequivalent to Tricor micronized fenofibrate capsule (1 x 200 mg)”. So, are 145 mg (new formulation) and 200 mg (old formulation) considered same molar doses? Or do they mean same “bioavailable” dose?  In any case, the full story behind Abbott’s approach and the changes to regulations that followed is captured in the paper by Downing et al (2012).

So, myth dispelled? Not sure. Dose differences between test and reference are not that common.

Myth 7: I have a fixed-dose combination product (FDC) with a new molecule and an already approved drug product. If I run a BE study in the US with that product, I can use the same BE study for worldwide registration in all markets.

If you are the sponsor of the innovator product with a globally single compositional image dosage form, then you need not run BE studies to gain approvals within regional markets. For your generic component (already approved reference), however, it depends on what image is being used in that regional market and applicable Reference Listed Drug or their equivalents. Now, you are subject to regionally applicable guidances and availability of the product locally. Typically, depending on how the reference formulation appears in that market and how different it is from the one you studied, you may end up needing to run the BE study per market. The problem is you do not know how different or similar it is between, let us say, a US sourced reference vs EU sourced reference. You do not have access to the compositional details other than what is contained within the regulatory dossiers, and such sensitive information is usually redacted. Suffice it to say, you may need to prepare for a BE study, at least for the generic component, in every market you intend to register that FDC.

Myth 8: The intended marketed dose of my drug is 1000 mg, and I intended to use 5 tablets of 200 mg to create the dose. I am running a BE study, and I will be using the clinical dose.

BE studies typically consider the highest strength tablet for the study. In this case, you would use a 200 mg strength. The BE study tests the adequacy of the product performance and not the dose. If you have difficulty establishing bioanalytical sensitivity at the 200 mg strength, you could argue for using a higher dose. BE guidances will indicate that it is preferable to study the highest marketed strength as a single unit.

Bioequivalence is a heavily researched subject within biopharmaceutics. We hope we have highlighted some common themes where there is sufficient confusion around the purpose and necessity behind these concepts. Hopefully, we have cleared the air up a bit. If you have a formulation, it will likely undergo changes during its product lifecycle. Paying attention to concepts such as bioequivalence and the emerging quantitative approaches to demonstrate similarity can help to reduce the uncertainty around formulation switches, whether they are pre- or post-approval.

This blog was originally published in March 2022 and has been updated for accuracy.

References and recommended reading

Downing NS, et al (2012). How Abbott’s Fenofibrate Franchise Avoided Generic Competition Arch Intern Med. 14; 172(9): 724–730.

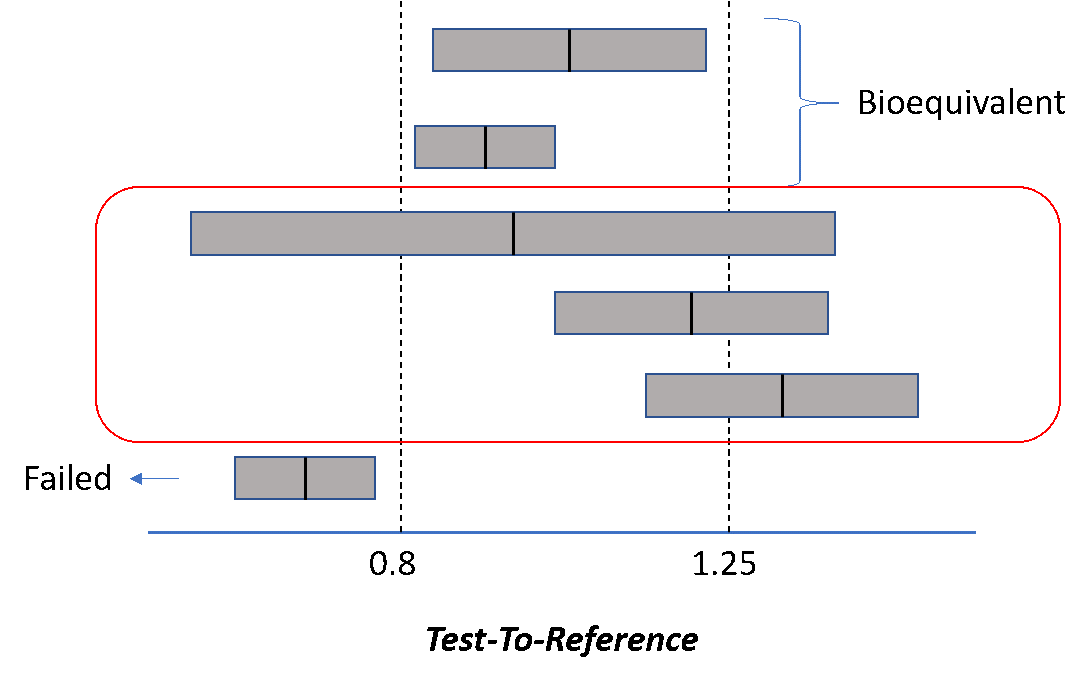
Food and Drug Administration (1999). Center for Drug Evaluation and Research (CDER). Statistical Information from the June 1999 Draft Guidance and Statistical Information for In Vitro Bioequivalence Data, Posted on August 18, 1999. US Department of Health and Human Services, Rockville, MD.

Food and Drug Administration. Drug Approval Package: Tricor (fenofibrate) Tablets; Applications No.: 021203 and 021656.

Julious S et al (2010). An Introduction to Statistics in Early Phase Trials, John Wiley & Sons, NY.

Food and Drug Administration (1992). Guidance for industry: statistical procedures for bioequivalence studies using a standard two treatment crossover design. US Department of Health and Human Services, Rockville, MD.

Food and Drug Administration (1995). SUPAC-IR: Immediate-Release Solid Oral Dosage Forms: Scale-Up and Post-Approval Changes: Chemistry, Manufacturing and Controls, In Vitro Dissolution Testing, and In Vivo Bioequivalence Documentation. US Department of Health and Human Services, Rockville, MD.

Food and Drug Administration (2001). Guidance for industry: statistical approaches to establishing bioequivalence. US Department of Health and Human Services, Rockville, MD.

Food and Drug Administration (2003). Guidance for industry: bioavailability and bioequivalence studies for orally administered drug products—general considerations. US Department of Health and Human Services, Rockville, MD.

Food and Drug Administration (2014). Guidance for industry: Bioavailability and Bioequivalence Studies Submitted in NDAs or INDs — General Considerations. US Department of Health and Human Services, Rockville, MD.

Krishna R, Yu L (2007). Biopharmaceutics applications in drug development, Springer, NY.

US Code of Federal Regulations. (2000). Bioavailability and bioequivalence requirements. US Government Printing Office, Washington, DC, Vol. 21, Part 320. Also see: https://www.govinfo.gov/content/pkg/CFR-2009-title21-vol5/pdf/CFR-2009-title21-vol5-sec320-1.pdf.

Williams RL et al (1976). Where are we now and where do we go next in terms of the scientific basis for regulation on bioavailability and bioequivalence? FDA Biopharmaceutics Coordinating Committee. European Journal of Drug Metabolism & Pharmacokinetics 25, 7 – 12.

FAQs

What software can I use to perform bioequivalence analyses?

Several programs, proprietary and non-proprietary, can be used to analyze data from BE studies. For example, Certara’s Phoenix WinNonlin® can be used to perform bioequivalence studies as well as reference-scaled average bioequivalence (RSABE). This is a statistical approach increasingly adopted to assess bioequivalence for highly variable drugs (HVDs).

What is virtual bioequivalence?

Virtual bioequivalence (VBE) refers to demonstrating bioequivalence using physiologically-based pharmacokinetic models instead of performing a clinical BE study. Many proprietary and non-proprietary software can run such VBEs, including Certara’s own Simcyp® Simulator.

If I get a similarity factor in dissolution studies of f₂ ≥ 50. what does that mean?

If your dissolution comparison gives f₂ ≥ 50, it means the test and reference products have similar dissolution profiles.

When Is VBE Most Valuable?

Virtual bioequivalence is most useful when:

  • Clinical BE studies are expensive or risky.
  • Dissolution data show small but uncertain differences.
  • Regulatory justification needs strengthening.
  • Multiple strengths require bridging.
  • Ethical concerns limit in-vivo studies.

Rajesh Krishna, PhD

Senior Distinguished Scientist, Drug Development Solutions

Rajesh is a scientific key opinion leader with 25+ years in drug development, specializing in model-informed strategies for biologics, vaccines, and small molecules. Currently a Senior Distinguished Scientist at Certara, he leads strategic consulting and the CDDS centers of excellence.  Previously, he founded Merck’s quantitative clinical pharmacology department and held key roles at Aventis and Bristol-Myers Squibb. Rajesh holds a PhD in Pharmaceutical Sciences (University of British Columbia) and an MBA in Strategy and Innovation (Warwick).  Consistently recognized among the top 2% of influential scientists, his work includes 100+ publications, 89 posters, and 4 books.  He is an elected fellow of AAPS.

Contact us heading