November 14, 2025
PK sampling
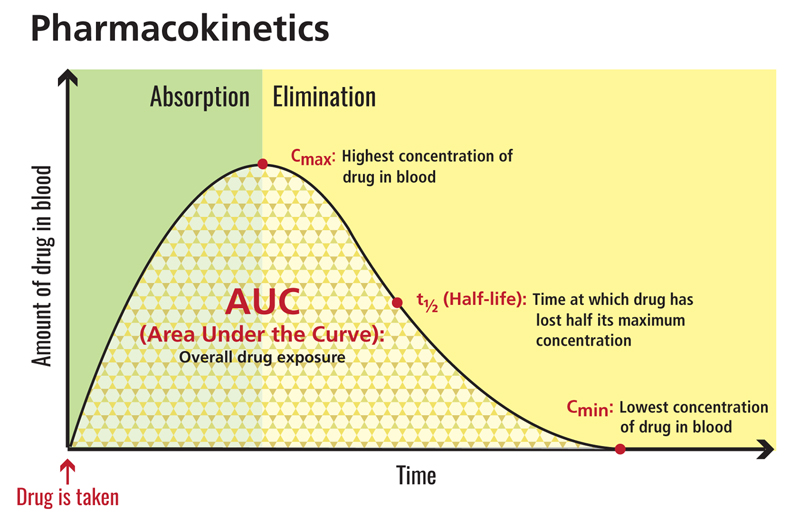
PK sampling following single- and multiple-dose administration in early development—first-in-human (FIH) studies and late-stage Phase 2-3 studies—are critical in characterizing the PK of the drug and will help in the evaluation of exposure-response relationships across dose levels.
The objective of PK sampling is to understand drug exposure over a range of dose levels and across the duration of dosing. For a small molecule, this can often be done with a few days of sampling at various times over the drug administration period. The samples are frequently close together. For large molecules, like monoclonal antibodies, the duration of PK sample collection stretches over multiple weeks, although the samples may be collected several days apart.
Characterizing the area under the time-concentration curve, drug clearance, elimination half-life, peak/trough concentrations, and other rudimentary PK parameters will provide more informed decision making during the dose escalation process and a better understanding of the exposure-response profile of the drug. Once this is understood, less frequent (sparse) sampling can be employed in later studies. These are analyzed using PopPK modeling from late-stage Phase 2-3 studies, using broader patient populations, allowing investigation of the effects of intrinsic and extrinsic variables of the drug’s PK and link to safety and efficacy biomarkers.
Data from the PK sampling helps to determine the correct dose and factors that might impact it (body weight, age, sex etc.). It also helps to determine the conditions of dosing (e.g. with food or on an empty stomach).
Source: clinicalinfo.hiv.gov 4
Case studies: applying M&S in oncology drug development
The real impact of modeling and simulation is best illustrated through real-world case studies. The following examples highlight how M&S approaches are applied in practice.
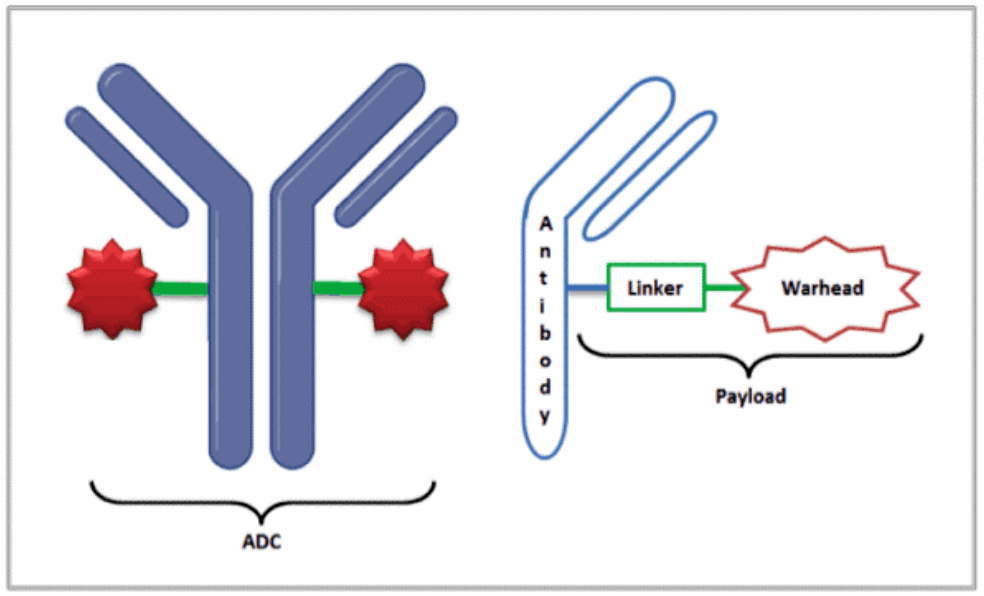
Antibody–drug conjugates (ADCs)
Antibody–drug conjugates pose unique challenges due to their complex structure and narrow therapeutic index. A QSP platform model developed with HER2-targeted ADCs (T-DM1 and Enhertu) successfully predicted clinical pharmacokinetics, tumor payload distribution, and hematological toxicities. Virtual clinical trial simulations replicated observed response differences between HER2-high and HER2-low populations, enabling researchers to identify the most sensitive parameters and anticipate therapeutic index limits. This work demonstrated how ADC models can integrate preclinical data to inform safe and efficacious dosing strategies in humans.
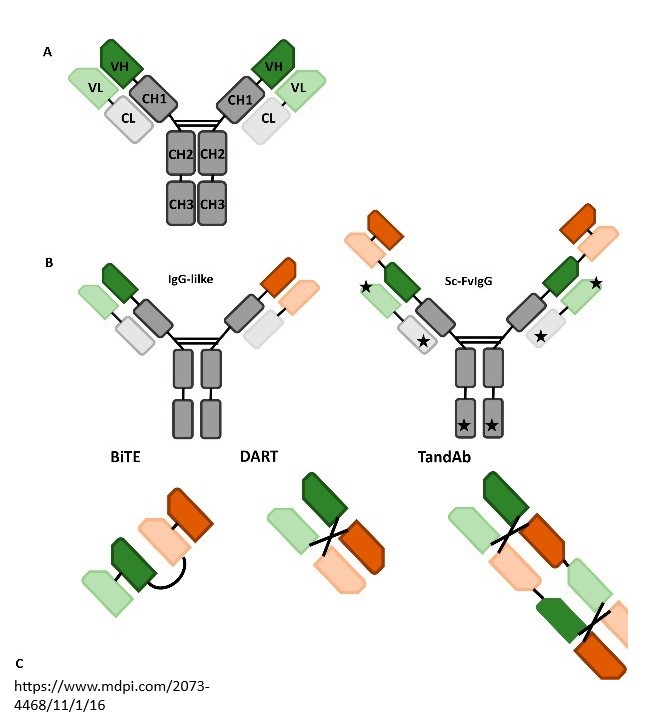
Bispecifics and multi-specifics
For bispecific antibodies, such as ATG-101 (a PD-L1/4-1BB bispecific), mechanistic modeling provided insights into the bell-shaped dose-response relationship often seen with receptor crosslinking agents. The model was used to predict the “sweet spot” where both trimer formation and checkpoint blockade were maximized, guiding a first-in-human dose and differentiating ATG-101 from competitor molecules. Similarly, multi-specific T-cell engagers were modeled to establish MABEL-based starting doses by linking in vitro trimer formation to in vivo efficacy and cytokine release, ensuring a rational and safe clinical entry strategy.
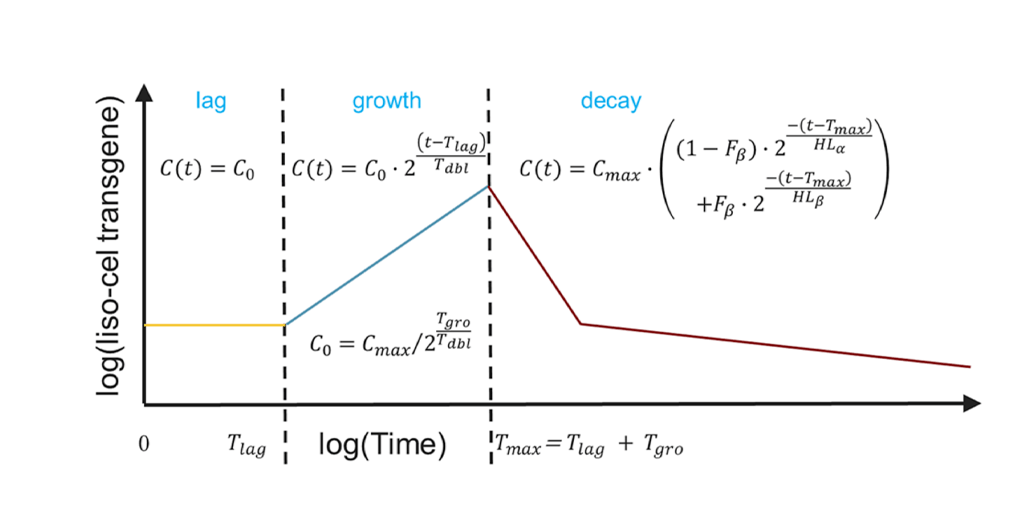
Cell and gene therapies
For CAR-T therapies, M&S approaches captured the living-cell kinetics that distinguish these products from traditional drugs. Mechanistic PK/PD models reproduced the hallmark expansion–contraction–persistence dynamics of CAR-Ts in lymphoma patients, while sensitivity analyses highlighted tumor characteristics (e.g., antigen density, division time) that could strongly influence outcomes.
Building on this, Certara’s QSP software, Certara IQ™, for multiple myeloma CAR-T therapies integrated clinical data from anti-BCMA and anti-GPRC5D trials, enabling virtual patient simulations to explore dosing strategies, sequence of combination regimens, and the potential of bi-specific CAR-T constructs.
For more information, watch the on-demand webinar or read the full publication.
Monoclonal antibodies and checkpoint inhibitors
Mechanistic PK/PD modeling has also supported dose justification for checkpoint inhibitors. For cosibelimab (CK-301), simulations compared tumor receptor occupancy against approved PD-L1 inhibitors, demonstrating that dosing at 800–1200 mg every two or three weeks could achieve >99% PD-1 receptor occupancy. This gave regulators and developers confidence that cosibelimab could deliver efficacy comparable to established therapies.
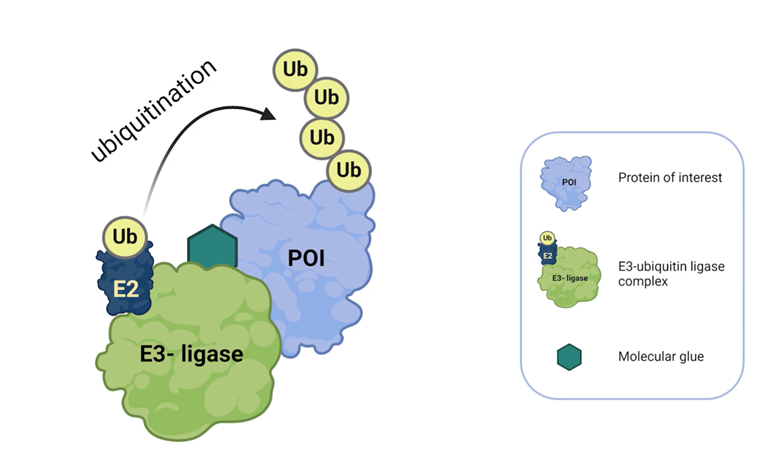
Molecular glues and targeted protein degraders
Novel modalities such as molecular glue degraders (MGDs) also benefit from modeling. In vitro and in silico models of lenalidomide and pomalidomide degradation pathways accurately reproduced degradation kinetics of transcription factors Ikaros and Aiolos. These tools allowed researchers to scan binding affinities, turnover rates, and ligase expression to identify tunable properties for optimizing degraders while avoiding off-target effects.
Small molecules and targeted inhibitors
M&S methods like QSP modeling have been instrumental for small molecule oncology drugs. In collaboration with a large pharma company, a QSP model was developed for their molecule, a KRAS-G12C inhibitor, to assess performance against a leading competitor in the market. The QSP model successfully predicted superior tumor responses compared with the leading competitor, despite lower systemic exposure, due to its higher binding affinity. Virtual clinical trials supported confidence in advancing our partner’s molecule to the clinic as a potential best-in-class compound. Similarly, PK/PD and PK/TGI models have been widely applied to small molecules, scaling preclinical tumor inhibition data to humans, and helping identify safe and efficacious first-in-human dosing strategies.
Oncolytic viruses
Finally, QSP modeling has extended to oncolytic viruses, which selectively replicate in tumors while stimulating systemic immune responses. For a myxoma virus–based platform, models predicted systemic cytokine exposure following intravenous administration, incorporating virus kinetics, transgene-driven cytokine production, and secondary immune responses. Simulations indicated that even at high doses, predicted cytokine levels would remain within known safety limits, providing confidence to proceed with planned clinical dosing. This approach illustrates how modeling can bridge preclinical and translational data in an emerging therapeutic class.

Capturing CAR T-cell Therapy Dynamics Through Mechanistic Modeling
Watch our on-demand webinar to learn more about Capturing CAR T-cell Therapy Dynamics Through Mechanistic Modeling

Senior Director, Clinical Pharmacology and Translational Medicine
Dr. Osborn has over 25 years of drug development experience in the areas of clinical pharmacology and pharmacokinetics. She has focused primarily oncology and anti-infectives. Before joining Certara, she was a reviewer in the Office of Clinical Pharmacology, US Food and Drug Administration, in the Division of Cancer Pharmacology, CDER where, she participated in the assessment of multiple dose justification submissions under Project Optimus. Prior to working in the FDA, she was a clinical pharmacologist in the National Institute of Allergy and Infectious Diseases (NIAID) at the National Institute of Health (NIH). There, projects were focused on therapeutics and vaccines in the infectious disease area. She worked on design and support of phase 1 trials, bioanalytical assay development and validation, and projects using the “Animal Rule” to support development of countermeasures in situations where clinical trials were not ethical or feasible. Dr. Osborn has held roles supporting both clinical and nonclinical pharmacology drug development for large molecules in biotechnology companies including Human Genome Sciences and CoGenesys. She is particularly interested in early phase drug development, including dose selection and justification strategies to speed development of therapeutics.
Dr. Osborn is holds a Ph.D. in Pharmacology from The George Washington University and is based in the Washington DC metropolitan area.

Content Marketing Manager
Charlotte is a content marketing specialist with ten years’ experience planning and executing corporate marketing strategies. She works within Certara’s Content Marketing team, developing educational and persuasive content primarily supporting the Pinnacle 21 platform. Charlotte joined the Certara team during the acquisition of Formedix in 2023.
References
[1] Bullock JM, Lin T, & Bilic S. (2017). Clinical pharmacology tools and evaluations to facilitate comprehensive dose finding in oncology: A continuous risk-benefit approach. J. Clin. Pharmacol., 57(510), 5105–5115.
[2] Ishida Y, Murai K, Yamaguchi K, et.al. (2016). Pharmacodynamics and pharmacodynamics of dasatinib in the chronic phase of newly diagnosed chronic myeloid leukemia. Eur. J. Clin. Pharmacol., 72(2), 185–193.
[4] clinicalinfo.hiv.gov. (n.d.). Area Under the Curve (AUC) | NIH. [online] Available at: https://clinicalinfo.hiv.gov/en/glossary/area-under-curve-auc.
[3] US Department of Health and Human Services, Food and Drug Administration, Center for Drug Evaluation and Research. (2016). Clinical Pharmacology Review, Application Number 205552Orig1s000. Retrieved from https://www.accessdata.fda.gov/drugsatfda_docs/nda/2013/205552Orig1s000ClinPharmR.pdf
This blog was originally published in April 2018, and has been updated for accuracy.
Learn more about Modeling and Simulation Services
Certara’s modeling and simulation services provide valuable insights, de-risk your projects, optimize decisions, and accelerate timelines across all phases of drug development.

Contact us