April 2, 2025
Linear trapezoidal method
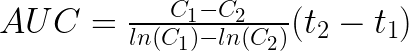
The linear trapezoidal method estimates AUC by applying linear interpolation between concentration-time data points. In simple terms, it connects adjacent concentrations with straight lines, forming trapezoids, and sums their areas to calculate the total AUC. For a given time interval (t1 – t2), the AUC is calculated as:
![]()
Here, the first two terms represent the average concentration over the time interval, while (t1 – t2) is the duration of the time interval. The linear method applies the average concentration across the entire time interval.
By summing AUC values across all intervals, you obtain the total drug exposure from the first to the last time point. Dividing this total AUC by the total elapsed time provides the average drug concentration in the body over the study period.
The linear trapezoidal method is simple to implement, requiring only basic arithmetic. It was the first method historically used but can overestimate AUC, as it does not account for the exponential decline of drug elimination.
Want to deepen your understanding of AUC and other PK/PD concepts? Get free access to Pharmacokinetic and Pharmacodynamic Data Analysis ebook.
Logarithmic trapezoidal method
The logarithmic trapezoidal method calculates AUC using logarithmic interpolation between concentration-time data points. This method is particularly useful when concentrations are decreasing, as first-order drug elimination follows an exponential decline, which appears linear on a logarithmic scale. For a given time interval (t1 – t2), the AUC is calculated as:
This method assumes that C1 > C2 And provides a logarithmic average of the two concentrations. Similar to the linear method, the average concentration is multiplied by the time interval.
The figure below illustrates the difference between the linear and logarithmic trapezoidal methods. The blue line represents the true mono-exponential decline of drug concentration, while the red line shows the AUC estimation using the linear trapezoidal method. Since the linear trapezoidal method assumes a straight-line decline between sampling points (at 16 and 20 hours), it overestimates drug exposure, as seen by the red line sitting above the blue line.
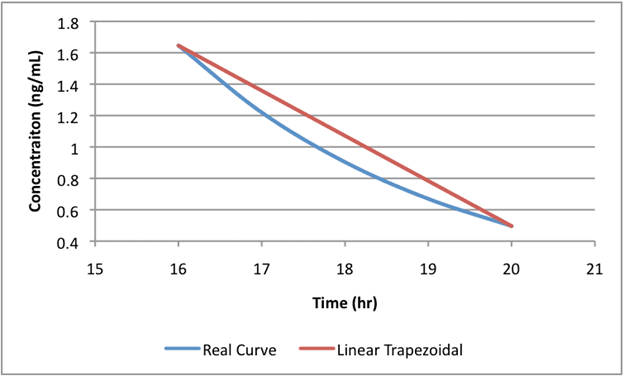
As illustrated above, the logarithmic trapezoidal method is more accurate for decreasing concentrations, as it accounts for the exponential nature of drug elimination; however, when sampling points are closely spaced, the difference between this method and the linear trapezoidal method is less pronounced.
How are these AUC methods implemented in Phoenix WinNonlin?
In Phoenix WinNonlin, the Non-Compartmental Analysis (NCA) object provides four AUC calculation methods, each affecting how total and partial AUCs are computed.
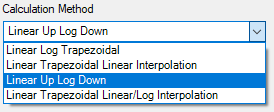
1. Linear Log Trapezoidal: uses the linear trapezoidal method up to Cmax and then switches to the log trapezoidal method for the remainder of the curve. When computing partial AUCs after Cmax, concentrations are estimated using logarithmic interpolation. Otherwise, linear interpolation is applied.
2. Linear Trapezoidal Linear Interpolation: applies the linear trapezoidal method for AUC all calculations. For partial AUCs, concentrations are estimated using linear interpolation, and linear extrapolation is used beyond the last observed concentration.
3. Linear Up Log Down: uses the linear trapezoidal method when concentrations are increasing and the log trapezoidal method when concentrations are decreasing. For partial AUCs, linear interpolation is applied if the surrounding concentrations are increasing, while logarithmic interpolation is used if concentrations are decreasing. This method does not depend on Cmax, making it more flexible for profiles with secondary peaks.
4. Linear Trapezoidal Linear/Log Interpolation: uses the linear trapezoidal method for AUC calculation. It differs from the Linear Trapezoidal Linear Interpolation method just when partial areas are selected at an endpoint that is not in the dataset. In that case, a logarithmic interpolation is used to insert points after Cmax.
Want to deepen your understanding of AUC and other PK/PD concepts? Get free access to the 5th edition of Prof. Johan Gabrielsson’s renowned reference, Pharmacokinetic and Pharmacodynamic Data Analysis.

Executive Director, Training & Certara University
Ana leads the Certara University team in providing modeling and simulation for new drug development through education, skills, and expertise in the global healthcare industry. Ana has more than 20 years experience in a variety of roles in the industry. She has extensive experience in pharmaceutical training, software demonstration, software support, and product management, Ana is also an adjunct faculty member at Skaggs College of Pharmacy and Pharmaceutical Sciences at the University of Colorado.
This blog was originally published in April 2011, and has been updated for accuracy.
Contact us
We’re committed to delivering content that truly matters to you most so Phoenix Newsletters are your go-to monthly resource for the latest and greatest Phoenix insights.