search

October 16, 2025

In pharmacokinetic/pharmacodynamic (PK/PD) research, Tables, Figures, and Listings (commonly known as TFLs, sometimes as TLFs) are critical for presenting study data in a structured, reproducible format. Whether it’s concentration–time profiles or dose–response plots, regulatory agencies depend on TFLs to evaluate drug safety and efficacy. But while the expectations for clarity and compliance continue to rise, many teams are still relying on outdated, manual workflows to create their TFLs.

This blog explores current regulatory requirements, compares traditional tools like Excel, SAS, and R with modern alternatives, and introduces TFL Studio, Certara’s new solution built specifically to streamline PK/PD reporting.

Regulatory Expectations: Structure, Transparency, and Traceability

Regulatory guidelines like ICH E3 lay out clear expectations for how data should be reported in clinical and nonclinical study documents. Agencies such as the FDA and EMA require:

  • Clear labeling of datasets (e.g., PK analysis set vs. safety population)
  • Documentation of deviations and exclusions
  • Detailed listings of individual patient data
  • Reproducible, traceable outputs
  • Use of validated tools compliant with standards like 21 CFR Part 11

In practice, this means TFLs must not only look polished but also be auditable and consistent – requirements that can be challenging to meet using spreadsheets or loosely coordinated scripting workflows.

The Limitations of Traditional Tools

Excel: Easy to Use, Hard to Trust

Excel is familiar and flexible, but it’s not built for complex PK/PD reporting. Manual formatting, formula errors, and lack of audit trails make it risky for regulatory work. Reproducing results or tracking changes across multiple versions is nearly impossible.

SAS and R: Powerful but Complex

Statistical programming tools like SAS and R offer greater control and reproducibility, but they require significant coding expertise. For teams under time pressure—or without dedicated programmers – these tools can slow down the reporting process and add complexity.

Introducing TFL Studio: Purpose-Built for PK/PD Teams

TFL Studio is a new module in Certara’s Phoenix platform that combines the rigor of traditional programming with the ease of a modern user interface. Here’s how it stands out:

1. User-Friendly Workflow

With TFL Studio, scientists can create publication-ready tables and figures using customizable templates – no coding required. The point-and-click interface makes it easy to generate complex Tables, Figures and Listings in just a few steps, reducing reliance on programmers.

2. Template-Driven Automation

TFL Studio supports batch generation of TFLs from source data, allowing users to map data to templates without manual reformatting. Analysts can reuse custom-built tables and figures across studies, significantly accelerating the reporting timeline.

3. Built-In Traceability

Every transformation and setting applied in TFL Studio is stored as part of the output definition. An audit log tracks edits automatically, making it easy to demonstrate how outputs were created and to meet regulatory traceability standards.

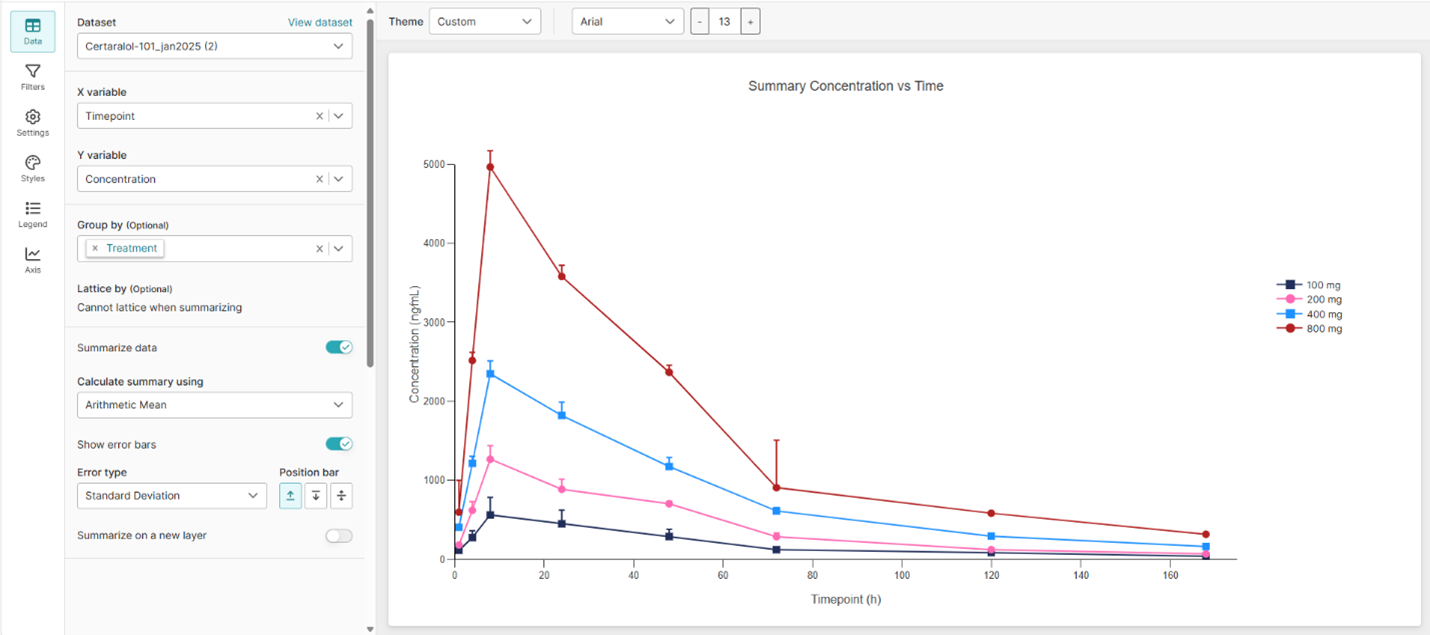
Line graph titled ‘Summary Concentration vs Time’ showing drug concentration (ng/mL) over time (hours) for four dose groups: 100 mg, 200 mg, 400 mg, and 800 mg. Each line peaks early then declines, with higher doses producing higher peak concentrations. Error bars indicate standard deviation.

Compliance and Collaboration at Scale

One of the standout features of TFL Studio is its ability to streamline collaboration and quality control:

  • Real-Time Review: Team members can review and comment on outputs directly within the platform – no more back-and-forth email threads or version confusion.
  • Centralized QC: All feedback is logged in one place, ensuring corrections are applied consistently and transparently.
  • Regulatory-Ready Outputs: TFL Studio adheres to global style standards, supports consistent footnotes, units, and titles, and integrates with Phoenix’s 21 CFR Part 11-compliant data repository Integral for added peace of mind.

Why It Matters

For PK/PD teams navigating tight timelines, complex data, and evolving regulatory expectations, the stakes are high. TFL Studio offers:

  • Speed: Automate routine work and focus on analysis.
  • Accuracy: Minimize errors through traceable, standardized workflows.
  • Collaboration: Work seamlessly across teams and roles.
  • Compliance: Meet global regulatory standards with built-in audit capabilities.

Discover how TFL Studio and AI PK Reports can help you work faster, smarter, and more accurately through AI-powered automation.

Final Thoughts

Tables, figures and Listings remain essential to regulatory success in drug development – but the way we produce them doesn’t have to stay stuck in the past. TFL Studio represents a step forward: combining usability, automation, and compliance in one powerful platform tailored to the needs of PK/PD professionals.

If you’re ready to modernize your reporting workflows, it’s time to explore what TFL Studio can do for your team.

Learn more about TFL Studio

The “Easy Button” for Your Everyday PK/PD Analysis

Learn moreBook a demo
Kristin Follman, PhD

Principal Research Scientist

Dr. Kristin Follman is a Principal Research Scientist at Certara, where she is a member of the team building the TFL module. She obtained a PhD in Pharmaceutical Sciences from the University at Buffalo where her work focused on drug transporters in the treatment of overdose and renal impairment. Prior to joining the software division, Kristin worked as a consultant at Certara for 5 years where her area of expertise was quantitative clinical pharmacology, with a focus on translational PK/PD modeling and simulation.

FAQS

What are TLFs (Tables, Listings, and Figures) in clinical trials?

TLFs, or Tables, Listings, and Figures (sometimes called TFLs), are standardized formats used in clinical and PK/PD reporting to present study data clearly and reproducibly. They help regulatory reviewers assess drug safety and efficacy by summarizing key data like patient demographics, lab results, and dose–response relationships. Each element serves a purpose: tables for summary data, listings for individual records, and figures for visual insights.

How does TLF automation improve PK/PD reporting efficiency?

Automating TLF generation eliminates repetitive manual steps, enabling faster, more consistent reporting. With tools like TFL Studio, analysts can generate publication-ready outputs from templates without coding, ensuring traceability and regulatory compliance. Automation also supports reproducibility across studies and reduces quality control cycles.

What are the main differences between creating TLFs in Excel and TFL Studio?

Excel offers flexibility but lacks audit trails and reproducibility, making it risky for regulated studies. TFL Studio, by contrast, provides an audit-compliant, template-driven workflow where TLFs can be generated automatically and reviewed collaboratively. It combines the ease of Excel’s interface with the traceability of validated software, streamlining compliance and efficiency.

How does TFL Studio ensure compliance with FDA and EMA standards?

TFL Studio was designed with regulatory compliance in mind, aligning with ICH E3 and 21 CFR Part 11 standards. It maintains audit logs, version control, and secure data integration through Phoenix Integral. These features ensure all generated outputs are traceable, reproducible, and ready for regulatory submission.

Be the first to experience the new Phoenix TFL Studio